Better Life Laboratories, Inc. is a nonprofit organization. It conducts scientific research and provides technical expertise, equipment, and training to help needy people around the world.

Go To Next Page Go To Previous Page Return To Homepage Learn About Better Life Laboratories How to Make a Tax Deductible Contribution of Money or Equipment to Better Life Laboratories

Materials and Methods

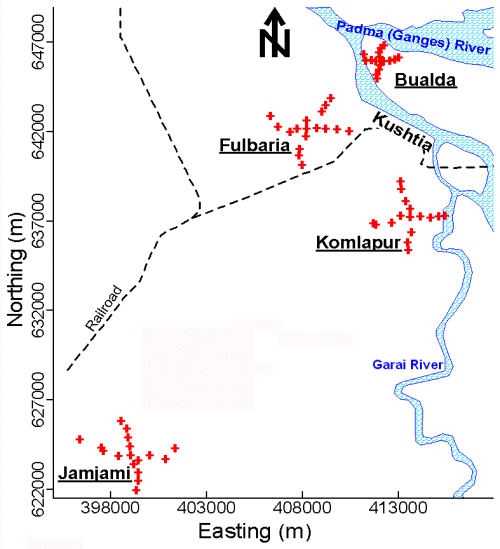
  1. Sample Collection, Preservation, Shipment, and Analyses. Groundwater samples were collected from 4 neighborhoods in western Bangladesh during July 18 to 21, 2002 (Figure 1). A total of 71 random samples were collected from 67 tubewells in these 4 neighborhoods. A total of 18 random samples were collected from 17 tubewells in each of 3 neighborhoods. Access was denied at 1 sampling location; therefore, a total of 17 random samples were collected from 16 tubewells in the fourth neighborhood.

    Map of western Bangladesh showing the 4 neighborhoods where groundwater samples were collected from tubewells.
    Figure 1. Map of western Bangladesh showing the 4 neighborhoods where groundwater samples were collected from tubewells. These 4 neighborhoods are centered in the villages of Fulbaria, Bualda, Jamjami, and Komlapur. Each sampling location is labeled with a +. Kushtia is a major city. The Padma and Garai Rivers are outlined. (Reproduced from Frisbie SH, Mitchell EJ, Yusuf AZ, Siddiq MY, Sanchez RE, Ortega R, Maynard DM, Sarkar B. The development and use of an innovative laboratory method for measuring arsenic in drinking water from western Bangladesh. Environmental Health Perspectives 113(9):1196-1204 (2005).)

    To the extent possible, the sampled tubewells in each neighborhood were distributed at 500-meter intervals along perpendicular axes that radiated in 4 equal lengths from the center (Figure 2). Two samples were collected from the centermost tubewell in each neighborhood. One sample was collected from each of the remaining tubewells. The latitude and longitude of these tubewells were determined using a Garmin Global Positioning System 12 Channel Personal Navigator™. The accuracy of this instrument was approximately 15 meters.
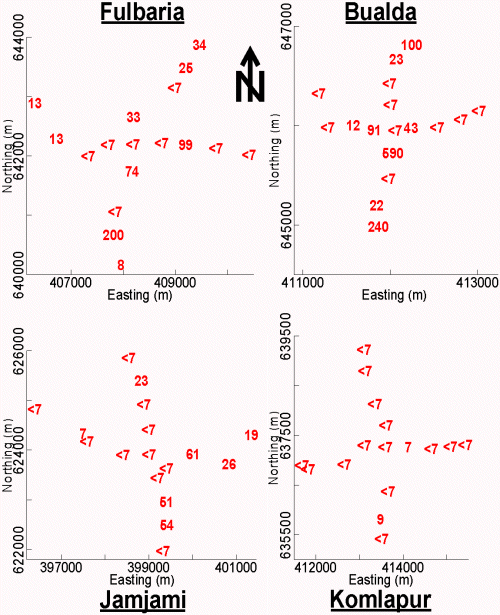
    Map showing the 4 neighborhoods where groundwater samples were collected from tubewells.
    Figure 2. Map showing the 4 neighborhoods where groundwater samples were collected from tubewells. The As concentration (µg/L) by the arsenomolybdate method is shown at each sampling location. (Reproduced from Frisbie SH, Mitchell EJ, Yusuf AZ, Siddiq MY, Sanchez RE, Ortega R, Maynard DM, Sarkar B. The development and use of an innovative laboratory method for measuring arsenic in drinking water from western Bangladesh. Environmental Health Perspectives 113(9):1196-1204 (2005).)

    Established collection, preservation, and storage methodologies were used to ensure that each sample was representative of groundwater quality (APHA et al. 1995; Stumm and Morgan 1981). Accordingly, all sampled tubewells were purged by pumping vigorously for 10 minutes (min) immediately before sample collection. All samples were collected directly into polyethylene bottles. These samples were not filtered. Samples were analyzed immediately after collection with pH paper, preserved by acidification to pH < 2 with 5.0 Molar (M) hydrochloric acid (HCl), and stored in ice-packed coolers. The temperature of all stored samples was maintained at 0º to 4º Celsius (C) until immediately before analysis at laboratories in Dubai and Vermont. In Dubai, all of these samples were analyzed for As by both the arsenomolybdate and AgSCSN(CH2CH3)2 methods. The samples were subsequently shipped to Vermont and analyzed for As by GFAAS. Contour maps of the As concentration in tubewell water from these 4 neighborhoods were drawn (Figure 3).
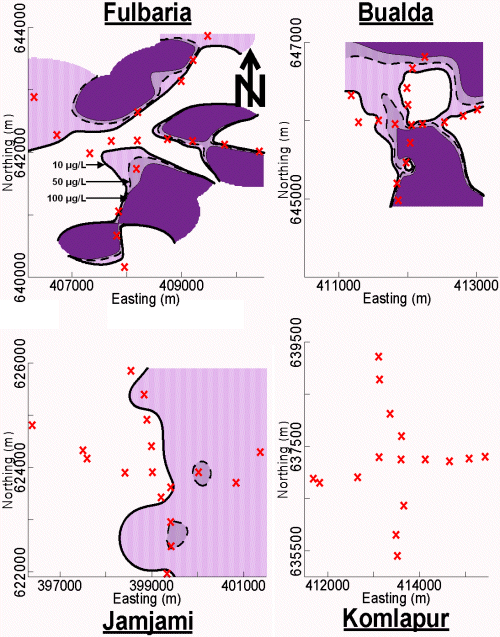
    Contour maps of As concentration in tubewell water from the 4 neighborhoods in this study.
    Figure 3. Contour maps of As concentration (µg/L) in tubewell water from the 4 neighborhoods in this study. These As concentrations were measured using the arsenomolybdate method. Each sampling location is labeled with a X. The bold contour line represents the 10-µg/L WHO health-based drinking water guideline. (Reproduced from Frisbie SH, Mitchell EJ, Yusuf AZ, Siddiq MY, Sanchez RE, Ortega R, Maynard DM, Sarkar B. The development and use of an innovative laboratory method for measuring arsenic in drinking water from western Bangladesh. Environmental Health Perspectives 113(9):1196-1204 (2005).)

  2. Quality Control of Laboratory Analyses. All 3 methods for determining As were calibrated daily. The calibration for the AgSCSN(CH2CH3)2 method used 5 different standards, including a blank. The calibrations for the arsenomolybdate and GFAAS methods used 6 different standards, including blanks. All calibration standards were prepared from the same stock As solution. The concentration of the most dilute non-blank standard was between 1 and 10 times the method detection limit. Calibration check standards were analyzed every 20 samples and as the last analysis of each day to assess data quality. An externally supplied standard was used to assess the accuracy of the calibration standards and calibration check standards (APHA et al. 1995).

    The recovery of a known addition of standard to 8 different samples was used to assess the matrix effects of all 3 methods of determining As. In addition, 3 types of precision were measured for each method from the analysis of 7 different standards (precision of standards), the duplicate analyses of 8 different samples (precision of samples), and the analysis of a known addition of standard to 8 different samples (precision of known additions). The same 8 samples were used to assess the matrix effects and precisions of all 3 methods of determining As (Table 1; APHA et al. 1995).
  3. Measuring Arsenic using Arsenomolybdate. All samples were analyzed for As by the following method.

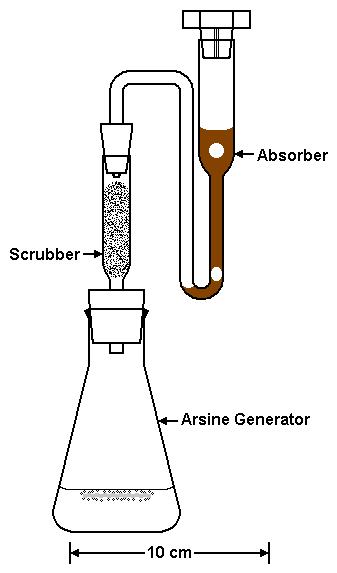
    1. Apparatus. The arsine generator, scrubber, and absorber are shown in Figure 4. The arsine generator is a 125-mL Erlenmeyer flask. The scrubber is made from a 10-mL volumetric pipette and a rubber stopper. The absorber is made from a 20-mL volumetric pipette, a rubber stopper, and a polyethylene cap. This cap has 4 grooves cut along its side to vent H2 gas without the loss of liquid during AsH3 generation. The spectrophotometer (Jenway product number 6305, Essex, UK) was set at 835 nanometers (nm) and used a 1.0-cm glass cell. All glassware was acid washed in 1.00 M HCl.

      The arsine generator, scrubber, and absorber that was used for the 2 colorimetric determinations of As.
      Figure 4. The arsine generator, scrubber, and absorber that was used for the 2 colorimetric determinations of As. (Reproduced from Frisbie SH, Mitchell EJ, Yusuf AZ, Siddiq MY, Sanchez RE, Ortega R, Maynard DM, Sarkar B. The development and use of an innovative laboratory method for measuring arsenic in drinking water from western Bangladesh. Environmental Health Perspectives 113(9):1196-1204 (2005).)

    2. Reagents.

      1. Stock As. Deliver 4.0 grams (g) of NaOH (Panreac Química, S.A. product number 131687, Barcelona, Spain) to a 1-L volumetric flask. Dissolve the NaOH with 10 mL of distilled water. Dissolve 1.320 g of As2O3 (Aldrich Chemical Company product number 22,762-5, Milwaukee, WI, USA) in the volumetric flask. Dilute to 1000 mL with distilled water.

      2. Intermediate As. Dilute 5.00 mL of stock As solution to 500 mL with distilled water.

      3. Standard As. Dilute 10.00 mL of intermediate As solution to 100 mL with distilled water.

      4. 50.0% (weight/volume) KI. Dilute 50.0 g of potassium iodide (KI) (BDH Laboratory Supplies product number 102123B, Poole, England) to 100 mL with distilled water. Store protected from light.

      5. 40.0% (weight/volume) SnCl2.2H2O. Dilute 40.0 g of stannous chloride dihydrate (SnCl2.2H2O) (BDH Laboratory Supplies product number 102704Q, Poole, England) to 100 mL with concentrated HCl.

      6. 10.0% (weight/volume) Pb(COOCH3)2.3H2O. Dilute 10.0 g of lead(II) acetate trihydrate (Pb(COOCH3)2.3H2O) (Aldrich Chemical Company product number 21,590-2, Milwaukee, WI, USA) to 100 mL with distilled water.

      7. I2/KI. Deliver 20.0 g of KI to a 500-mL volumetric flask. Dissolve the KI with approximately 250 mL of distilled water. Add 12.5 g of iodine (I2) (Aldrich Chemical Company product number 20,777-2, Milwaukee, WI, USA) and a Teflon®-coated magnetic stir bar to the volumetric flask. Mix until all the I2 dissolves; this may require several hours. Dilute to 500 mL with distilled water. Store protected from light. Prepare fresh weekly.

      8. 1.00 M NaHCO3. Dilute 8.40 g of sodium bicarbonate (NaHCO3) (BDH Laboratory Supplies product number 102474V, Poole, England) to 100 mL with distilled water.

      9. Concentrated H2SO4. Sulfuric acid (H2SO4), BDH Laboratory Supplies product number 102766H, Poole, England.

      10. Concentrated HCl. BDH Laboratory Supplies product number 101256J, Poole, England.

      11. Zn. Zinc (Zn), 20-mesh granules (Aldrich Chemical Company product number 24,346-9, Milwaukee, WI, USA).

      12. H2SO4/(NH4)6Mo7O24.4H2O. First, prepare 100 mL of 6.50 M H2SO4 in distilled water. Second, dilute 6.9 g of ammonium molybdate tetrahydrate ((NH4)6Mo7O24.4H2O) (BDH Laboratory Supplies product number 100282H, Poole, England) to 100 mL with distilled water. Finally, mix the 100 mL of 6.50 M H2SO4 and the 100 mL of 6.9% (weight/volume) (NH4)6Mo7O24.4H2O together.

      13. 6.00% (weight/volume) Na2S2O5. Dilute 6.00 g of sodium metabisulfite (Na2S2O5) (BDH Laboratory Supplies product number 301804E, Poole, England) to 100 mL with distilled water. Prepare fresh daily.

      14. 0.20% (weight/volume) SnCl2.2H2O. Dilute 0.50 mL of 40.0% (weight/volume) SnCl2.2H2O to 100 mL with distilled water. Prepare fresh daily.

    3. Sample Treatment. Deliver 35.0 mL of sample or standard to a 125-mL Erlenmeyer flask. Add 0.35 mL of 50.0% (weight/volume) KI and mix. Add 0.35 mL of 40.0% (weight/volume) SnCl2.2H2O and mix. Boil this mixture for 1.0 min to reduce As(V) to As(III). Use a water bath to cool the mixture to room temperature.

    4. Scrubber Preparation. Place 0.17±0.03 g of glass wool (Riedel-de Haën™ product number 18421, Seelze, Germany) onto a piece of filter paper (Whatman® product number 1001085, Kent, UK). Deliver 10 drops of 10.0% (weight/volume) Pb(COOCH3)2.3H2O to this piece of glass wool. Squeeze the glass wool in the filter paper to remove excess solution. Fluff the glass wool and place it in the scrubber (Figure 4).

    5. Absorber Preparation. Deliver 2.50 mL of I2/KI solution to a 20-mL test tube. Add 0.50 mL of 1.00 M NaHCO3 and mix. Pour this mixture into the absorber. Affix the cap to the absorber (Figure 4).

    6. Arsine Generation, Color Development, and Spectrophotometry. The amount of time for each step of this procedure, from adding concentrated H2SO4 to measuring the absorbance, must be consistent for all samples and all standards. Add 2.0 mL of concentrated H2SO4 to the treated sample or treated standard in the 125-mL Erlenmeyer flask and mix. Add 10.0 mL of concentrated HCl and mix. Add 1.0 mL of 40.0% (weight/volume) SnCl2.2H2O and mix. Add 5.0 g of Zn. Immediately connect the scrubber and absorber to the Erlenmeyer flask (Figure 4). Allow 30 min for the complete evolution of AsH3 from the Erlenmeyer flask to the absorber.

      Calibrate a test tube to receive 5.00 mL. Pour the liquid from the absorber to this test tube. Use 0.50 mL of distilled water to rinse the residual liquid from the absorber to the test tube. Add 1.00 mL of H2SO4/(NH4)6Mo7O24.4H2O solution to the test tube and mix. Add 0.50 mL of 6.00% (weight/volume) Na2S2O5 solution to the test tube and mix. The Na2S2O5 should change the mixture from deep reddish-brown to faint yellow. The brown color must be eliminated. If necessary, add distilled water to the test tube until its total volume of liquid is 5.00 mL and mix. Add 0.50 mL of 0.20% (weight/volume) SnCl2.2H2O to the test tube, mix, and wait 30 min for the bluish-green arsenomolybdate color to develop. Measure the absorbance at 835 nm.

    7. Calibration. Deliver 0, 0.50, 1.00, 2.00, 4.00 and 8.00 mL of standard As solution into 6 separate 125-mL Erlenmeyer flasks. Add distilled water until the total volume of liquid in each Erlenmeyer flask equals 35.0 mL (Figure 4). The resulting standards contain 0, 0.50, 1.00, 2.00, 4.00 and 8.00 µg As or 0, 14, 28.6, 57.1, 114, and 229 µg As/L, respectively. Use the "Sample Treatment", "Scrubber Preparation", "Absorber Preparation", and "Arsine Generation, Color Development, and Spectrophotometry" procedures to analyze these standards.

      Confirm that the calibration results obey Beer’s law. That is, test for a higher order polynomial relationship to confirm linearity, and test the null hypothesis that the y-intercept goes through the origin (Neter et al. 1985).

  4. Measuring the UV/Visible Spectrum of Arsenomolybdate. The purpose of this experiment is to measure the absorption maximum of arsenomolybdate. The absorption spectra of 3 arsenomolybdate samples were measured using an Agilent 8453 UV/Visible Spectroscopy System. The wavelengths of these spectra ranged from 190 nm to 1,100 nm. The spectrum of each arsenomolybdate sample was measured relative to a blank. Each arsenomolybdate sample was prepared from a 229 µg/L As standard solution using the "Sample Treatment", "Scrubber Preparation", "Absorber Preparation", and "Arsine Generation, Color Development, and Spectrophotometry" procedures described in "Measuring Arsenic using Arsenomolybdate". Similarly, each blank was prepared from a 0 µg/L As standard solution using these procedures. Each spectrum was measured after 30 min of color development.

  5. Measuring Arsenic using Silver Diethyldithiocarbamate. All samples were analyzed for As by the AgSCSN(CH2CH3)2 method (APHA et al. 1989). This method uses a 125-mL specimen jar for an arsine generator. The scrubber and absorber are identical to those shown in Figure 4. A 35.0 mL aliquot of sample or standard was delivered to the arsine generator. This sample or standard was treated with 5.0 mL of concentrated HCl, 2.00 mL of 15.0% (weight/volume) KI in distilled H2O, and 0.40 mL of 40.0% (weight/volume) SnCl2.2H2O in concentrated HCl to reduce As(V) to As(III). This reduction is allowed 15 min for completion and is done at room temperature. The scrubber was prepared as described in the arsenomolybdate method. The absorber received 4.00 mL of 0.50% (weight/volume) AgSCSN(CH2CH3)2 in pyridine (C5H5N). Then 3.0 g of Zn were added to the sample or standard to generate AsH3. After 30 min of AsH3 generation, the absorbate was measured spectrophotometrically at 535 nm.

  6. Measuring Arsenic using Graphite Furnace Atomic Absorption Spectroscopy. All samples were analyzed for As by GFAAS with a Buck Scientific 220AS autosampler, 220GF graphite furnace, and 210VGP atomic absorption spectrometer (East Norwalk, CT, USA). A 1.00 mL aliquot of standard As solution, sample, or diluted sample was loaded onto the autosampler. The 6 standards contained 0, 1.0, 5.0, 15.0, 30.0 and 50.0 µg As/L, respectively. The matrix of each 1.00 mL aliquot was modified with 50.0 µL of 10.0% (weight/volume) ammonium nitrate (NH4NO3) (Spectrum Chemicals & Laboratory Products product number A1216, New Brunswick, NJ, USA) in deionized water, 50.0 µL of 0.2% (weight/volume) palladium nitrate (Pd(NO3)2) in 2% (weight/volume) HNO3 (Buck Scientific product number K), and 50.0 µL of 1.79% (weight/volume) magnesium nitrate hexahydrate (Mg(NO3)2.6H2O) (EM Science product number 5855-1, Gibbstown, NJ, USA) in deionized water. The autosampler delivered a 20.0 µL aliquot of this mixture to the graphite furnace. The furnace tube was made from nonpyrolytic graphite (Buck Scientific product number BS300-1253). The furnace initialized at 100º C for 10 seconds (s), heated to 250º C for 20 s, dried the mixture at 250º C for 15 s, heated to 750º C for 25 s, ashed the mixture at 750º C for 10 s, heated to 2,200º C for 1.5 s, and atomized the mixture at 2,200º C for 3 s. The sheath and internal flows of argon (Ar) gas were 1,200 and 200 mL/min, respectively. The absorbance from a hollow-cathode lamp was read at 193.7 nm through a 0.7 nm slit and after deuterium (D2) background correction. This absorbance was measured for 2.4 s during atomization. Finally, this absorbance over time was used to calculate As concentration (Buck Scientific 2002; Harris 1999).

  7. Statistics. All 71 samples from this study were measured for As by the arsenomolybdate, AgSCSN(CH2CH3)2, and GFAAS methods. A paired t-test of the As concentrations from these samples was used to determine if the arsenomolybdate and AgSCSN(CH2CH3)2 methods gave equivalent or different results (Table 2). A second paired t-test used this methodology to determine if the arsenomolybdate and GFAAS methods gave equivalent or different results (Table 3). A third paired t-test used this methodology to determine if the AgSCSN(CH2CH3)2 and GFAAS methods gave equivalent or different results (Table 4). Each of these 3 paired t-tests was evaluated at the 95% confidence level (Snedecor and Cochran 1982).

    An F-test was used to determine if 2 precisions were equivalent or different. Precision is a standard deviation (Table 1; APHA et al. 1995). Therefore, precision squared is a variance (Snedecor and Cochran 1982). A ratio of these variances is an F-test of the equality of the corresponding precisions (Snedecor and Cochran 1982). Each F-test was evaluated at the 95% confidence level.

  8. Mapping. One contour map for each of the 4 neighborhoods in this study was drawn using the As concentration by the arsenomolybdate method, the sample location by the Global Positioning System, and the Surfer Surface Mapping System (Golden Software, Inc. version 7, Golden, CO, USA; see Figure 3). A variogram was used to select the equation that best matched the spatial continuity of the actual As concentrations in each neighborhood (Figure 2). Inverse distance weighted least squares equations (Shepard’s Method) were used for Fulbaria and Bualda. A logarithmic equation was used for Jamjami. No equation was used for Komlapur since all the samples in this neighborhood had As concentrations less than or equal to the 10-µg/L WHO drinking water guideline. These equations were used to map the contours shown in Figure 3.

  9. Societal Evaluation.

    1. Initial Interview During Sampling. One principal user of each tubewell was interviewed during groundwater sampling from July 18 to 21, 2002. Each interview was conducted in Bangla from a list of standard questions. Each interviewee was asked if alternative drinking water sources from rain, ponds, rivers, or canals were available. The number of users per tubewell, the depth of each tubewell, and the age of each tubewell were recorded. The results from previous As tests, if any, were documented. Any knowledge of users with melanosis, keratosis, gangrene, skin cancer, conjunctivitis, respiratory distress, or enlarged liver was recorded. Finally, the willingness of each interviewee to get safe drinking water from their neighbors, and to give safe drinking water to their neighbors was evaluated.

    2. Distributing Arsenic Results. Our field staff gave a Bangla language form letter to each interviewee 6 months after their groundwater was sampled. In addition, the contents of each letter were explained in Bangla by our field staff. Each letter had a summary of the neighborhood’s As results. Therefore, each interviewee knew if his tubewell had a safe or unsafe concentration of As. Furthermore, each interviewee knew which neighbor’s tubewell had a safe or unsafe concentration of As.

      Interviewees with As concentrations less than or equal to the 10-µg/L WHO drinking water guideline were informed that their tubewells were safe with respect to this element. In addition, they were informed that their tubewells should be tested for As at least once a year because the concentration of As can change over time (Frisbie et al. 1999; USAID 1997). Finally, they were asked to share their drinking water with those who could not get safe water from their own tubewells.

      Interviewees with As concentrations greater than the 10-µg/L WHO drinking water guideline were informed that their tubewells were unsafe with respect to this element. The imminent risk of serious health problems from continuing to drink this water was thoroughly explained. Finally, they were asked to get safe drinking water from their neighbors.

    3. Final Interview 1 Year After Sampling. Each original interviewee, if available, was revisited 1 year after their groundwater was sampled and 6 months after they were given the As results for their neighborhood. If the original interviewee was not available, then a surrogate interviewee was identified. These people were interviewed in Bangla from a list of standard questions. This final interview judged if the people with safe tubewells actually gave drinking water to their less fortunate neighbors; conversely, it also judged if the people with unsafe tubewells actually got safe drinking water from their more fortunate neighbors. In addition, it determined if the people with safe water followed our instructions and retested their tubewells for As. Finally, the health of all tubewell users was monitored.

Go To Next Page Go To Previous Page Return To Homepage Learn About Better Life Laboratories How to Make a Tax Deductible Contribution of Money or Equipment to Better Life Laboratories


Last updated September 10, 2005
Copyright © 2005 Better Life Laboratories, Inc. All rights reserved.