Better Life Laboratories, Inc. is a nonprofit organization. It conducts scientific research and provides technical expertise, equipment, and training to help needy people around the world.

Go To Next Page Go To Previous Page Return To Homepage Learn About Better Life Laboratories How to Make a Tax Deductible Contribution of Money or Equipment to Better Life Laboratories

Experimental Section

  1. Sample Collection, Preservation, and Analyses. Groundwater samples were collected from 4 neighborhoods in western Bangladesh (Figure 1). Western Bangladesh was chosen for this study because it has some of the widest ranges of groundwater As concentrations in the country, according to our 2 national-scale surveys (Frisbie et al. 1999; Frisbie et al. 2002; USAID 1997). Therefore, it is a region where both drinking water testing and treatment for As are important public health strategies. These neighborhoods were selected at random within this region.

    Satellite image of western Bangladesh showing the 4 neighborhoods where groundwater samples were collected from tubewells.
    Figure 1. Satellite image of western Bangladesh showing the 4 neighborhoods where groundwater samples were collected from tubewells (GlobeXplorer™, Walnut Creek, CA, USA). These 4 neighborhoods are centered in the villages of Bualda, Fulbaria, Jamjami, and Komlapur. Each sampling location is labeled with a +. Kushtia is a major city. (Reproduced from Frisbie SH, Mitchell EJ, Mastera LJ, Maynard DM, Yusuf AZ, Siddiq MY, Ortega R, Dunn RK, Westerman DS, Bacquart T, Sarkar B. Public health strategies for western Bangladesh that address the arsenic, manganese, uranium and other toxic elements in their drinking water. Environmental Health Perspectives doi: 10.1289/ehp.11886 (available at http://dx.doi.org/) Online 7 October 2008.)

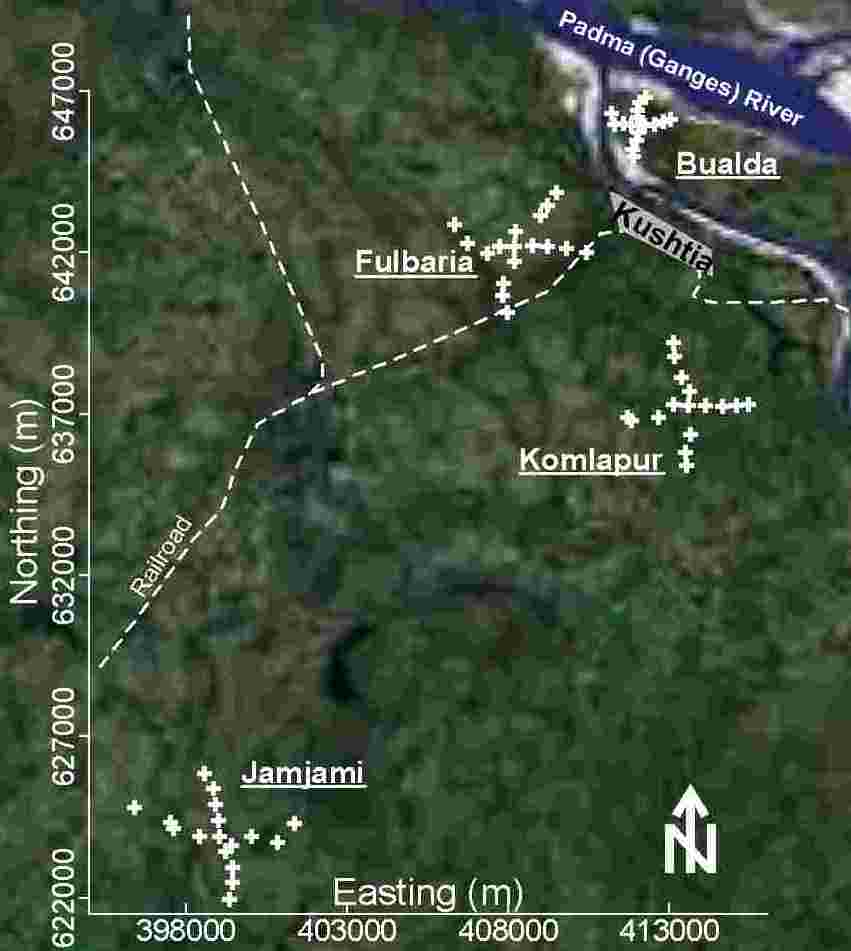
    A total of 71 samples were collected from 67 randomly selected tubewells in these 4 neighborhoods. A total of 18 samples were collected from 17 tubewells in each of 3 neighborhoods (Bualda, Fulbaria, and Jamjami). Access was denied at 1 sampling location; therefore, a total of 17 samples were collected from 16 tubewells in the fourth neighborhood (Komlapur). To the extent possible, the sampled tubewells in each neighborhood were distributed at 500-meter intervals along perpendicular axes that radiated in 4 equal lengths from the center (Figure 1). Two samples were collected from the centermost tubewell in each neighborhood. The results for each analyte from each of these 4 centermost tubewells were averaged. One sample was collected from each of the remaining tubewells. The northings and eastings of these tubewells were measured using a Global Positioning System 12 Channel Personal Navigator™ (Garmin International, Olathe, KS, USA).

    Established collection, preservation, and storage methodologies were used to ensure that each sample was representative of groundwater quality (APHA et al. 2005; Frisbie et al. 2005). Accordingly, all sampled tubewells were purged by pumping vigorously for 10 minutes immediately before sample collection. All samples were collected directly into polyethylene bottles. These samples were not filtered. Samples were analyzed immediately after collection with pH paper, preserved by acidification to pH < 2 with 5.0 Molar (M) hydrochloric acid (HCl; BDH Laboratory Supplies, product number 101256J, Poole, England), and stored in ice-packed coolers. The temperature of all stored samples was maintained at 0º to 4º Celsius (C) until immediately before analysis at laboratories in Dubai, France, and Vermont.

    Samples were shipped to Dubai and analyzed for As by the arsenomolybdate method (Frisbie et al. 2005). After which, the samples were shipped to France and analyzed for Ba, Cr, Mn, Mo, Ni, Pb, Se, U, and Zn by inductively coupled plasma mass spectrometry (ICPMS; PlasmaQuad PQ2+ Spectrometer, Fisons/VG Analytical, Manchester, UK; APHA et al. 2005). Finally, the samples were shipped to Vermont and analyzed for B by the azomethine H method, Fe by flame atomic absorption spectroscopy (FAAS; 210VGP Atomic Absorption Spectrometer, Buck Scientific, East Norwalk, CT, USA; APHA et al. 2005), and Sb by graphite furnace atomic absorption spectroscopy (GFAAS; 210VGP Atomic Absorption Spectrometer, Buck Scientific; APHA et al. 2005).

  2. Interviews. The depth, age, and number of users were determined for each tubewell by interviewing its owner or a principal user at the time of groundwater sampling. The interview was conducted in Bangla using a list of standard questions.

  3. Mapping and Statistics. Contour maps showing the concentrations of As, B, Ba, Cr, Fe, Mn, Mo, Ni, Pb, Sb, Se, U, and Zn, as well as pH, depth of tubewell, age of tubewell, and number of users per tubewell were drawn by hand for each of the 4 neighborhoods. These contours were drawn using linear interpolation. These maps were interpreted visually to help make hypotheses about the effects of geology on the distributions of these elements in groundwater. Standard methods of linear regression were used to test these hypotheses (Neter et al. 1985; Snedecor and Cochran 1982).

Go To Next Page Go To Previous Page Return To Homepage Learn About Better Life Laboratories How to Make a Tax Deductible Contribution of Money or Equipment to Better Life Laboratories


Last updated November 26, 2008
Copyright © 2008 Better Life Laboratories, Inc. All rights reserved.