Better Life Laboratories, Inc. is a nonprofit organization. It conducts scientific research and provides technical expertise, equipment, and training to help needy people around the world.

Go To Next Page Go To Previous Page Return To Homepage Learn About Better Life Laboratories How to Make a Tax Deductible Contribution of Money or Equipment to Better Life Laboratories

Results and Discussion

  1. The Distributions and Health Risks of Toxic Elements. All 71 groundwater samples from Bualda, Fulbaria, Jamjami, and Komlapur were analyzed for every toxic element that has ever been found above WHO health-based guidelines in Bangladesh’s drinking water: As, B, Ba, Cr, Mn, Mo, Ni, Pb, and U (BGS/DPHE 2001; Frisbie et al. 2002). In this study, As, Cr, Mn, Ni, Pb, and U were found above WHO health-based drinking water guidelines. Conversely, B, Ba, and Mo were not found above these guidelines. In addition, all samples were analyzed for Fe, Sb, Se, Zn, and pH (Tables 1, 2). A list of all of these elements follows. This list is arranged from the most to the least significant health risk in this study. The toxicity of these elements is summarized, and the rationale for WHO health-based drinking water guidelines is reviewed.

    Table 1. The average concentrations of toxic elements in Bualda, Fulbaria, Jamjami, and Komlapur’s groundwater, the WHO health-based drinking water guidelines for these toxins, and the percent of tubewells exceeding these guidelines. (Reproduced from Frisbie SH, Mitchell EJ, Mastera LJ, Maynard DM, Yusuf AZ, Siddiq MY, Ortega R, Dunn RK, Westerman DS, Bacquart T, Sarkar B. Public health strategies for western Bangladesh that address the arsenic, manganese, uranium and other toxic elements in their drinking water. Environmental Health Perspectives doi: 10.1289/ehp.11886 (available at http://dx.doi.org/) Online 7 October 2008.)

    Element Average Concentration
    (µg/L)
    WHO Health-Based
    Guideline (µg/L)
    % of Unsafe
    Tubewells a
    As
    B
    Ba
    Cr
    Fe
    Mn
    Mo
    Ni
    Pb
    Sb
    Se c
    U
    Zn c
    29
    < 50
    140
    4.7
    2,700
    800
    1.4
    11
    0.5
    1.6
    < 1
    2.5
    15
    10
    500
    700
    50
    NA b
    400
    70
    70
    10
    20
    10
    2
    NA
    33
    0
    0
    1
    NA
    78
    0
    1
    1
    0
    0
    48
    NA

    a Ninety-six percent (64 out of 67) of these tubewells are unsafe. That is, only 4% (3 out of 67) of these tubewells do not exceed any of these WHO health-based drinking water guidelines.
    b The WHO has not established a health-based drinking water guideline for Fe or Zn (WHO 1996a; WHO 1998a).
    c The severity of chronic As poisoning in Bangladesh might be magnified by a lack of Se or Zn or both (Frisbie et al. 2002; Ortega et al. 2003).

    Table 2. Correlation coefficients (r) for the concentrations of toxic elements in tubewell water from Bualda, Fulbaria, Jamjami, and Komlapur, the pH of this water, the depth of these tubewells, the age of these tubewells, and the number of users per tubewell. Significant linear relationships at the 99% confidence level are shown with a superscript "a". Significant linear relationships at the 95% confidence level are shown with a superscript "b". No significant linear relationships at either confidence level do not have a superscript. (Reproduced from Frisbie SH, Mitchell EJ, Mastera LJ, Maynard DM, Yusuf AZ, Siddiq MY, Ortega R, Dunn RK, Westerman DS, Bacquart T, Sarkar B. Public health strategies for western Bangladesh that address the arsenic, manganese, uranium and other toxic elements in their drinking water. Environmental Health Perspectives doi: 10.1289/ehp. 11886 (available at http://dx.doi.org/) Online 7 October 2008.)

    As B Ba Cr Fe Mn Mo Ni Pb Sb Se U Zn pH Depth Age Users
    As 1.00a                                
    B 0.81a 1.00a                              
    Ba 0.26b 0.40a 1.00a                            
    Cr 0.82a 0.92a 0.30b 1.00a                          
    Fe 0.82a 0.92a 0.40a 0.97a 1.00a                        
    Mn 0.46a 0.31b 0.19 0.26b 0.21 1.00a                      
    Mo 0.28b 0.05 0.16 -0.03 -0.01 0.28b 1.00a                    
    Ni 0.13 0.07 0.07 0.10 0.09 -0.09 -0.05 1.00a                  
    Pb 0.83a 0.94a 0.33a 0.98a 0.96a 0.28b -0.02 0.09 1.00a                
    Sb 0.34a 0.33a 0.56a 0.24 0.31b 0.38a 0.29b 0.40a 0.28b 1.00a              
    Se 0.32a 0.31b 0.48a 0.30b 0.32a 0.31b 0.10 0.11 0.35a 0.30b 1.00a            
    U -0.02 0.07 -0.27b 0.04 -0.05 0.18 -0.21 -0.02 0.08 0.04 0.09 1.00a          
    Zn 0.67a 0.69a 0.29b 0.73a 0.74a 0.15 0.19 0.03 0.70a 0.21 0.29b -0.14 1.00a        
    pH -0.02 -0.01 -0.11 0.02 0.00 0.05 -0.10 -0.20 0.03 -0.24 0.07 0.07 0.05 1.00a      
    Depth -0.10 -0.07 -0.17 0.00 -0.06 0.06 -0.15 -0.22 0.01 -0.28b -0.19 0.18 0.01 0.10 1.00a    
    Age -0.08 -0.03 -0.03 -0.05 -0.02 0.02 -0.17 -0.11 -0.03 0.01 0.16 0.27b -0.17 0.11 -0.13 1.00a  
    Users -0.07 -0.06 -0.11 -0.05 -0.06 -0.08 -0.07 -0.03 -0.04 -0.04 0.05 0.16 -0.12 0.07 0.02 0.10 1.00a

    1. Arsenic. Chronic As poisoning is the most significant health risk caused by drinking water from these 4 neighborhoods. As concentrations ranged from <7 µg/L to 590 µg/L, with 33% of tubewells above the 10 µg/L WHO drinking water guideline (Table 1; WHO 2004; WHO 2006). Drinking water with 10 µg/L of As has been associated with 3 extra deaths per 5,000 people from skin cancer (WHO 1996a; WHO 1996b) and 10 extra deaths per 5,000 people from bladder, liver, or lung cancer (Morales et al. 2000). In addition to these cancers, chronic As poisoning has been associated with melanosis, leukomelanosis, keratosis, hyperkeratosis, and nonpitting edema in Bangladesh (Frisbie et al. 2005).

    2. Manganese. Mn concentrations ranged from 160 µg/L to 2,400 µg/L, with 78% of tubewells above the 400 µg/L WHO health-based drinking water guideline (Table 1; WHO 2004; WHO 2006). Manganese is required for human nutrition; however, the accumulation of Mn may cause hepatic encephalopathy in humans (Layrargues et al. 1998). The chronic ingestion of Mn in drinking water is associated with neurological damage in humans (Kondakis et al. 1989; WHO 1996a; WHO 1996b). The WHO guideline for Mn in drinking water was calculated using the No Observed Adverse Effects Level (NOAEL) for these neurological effects in humans and laboratory animals (WHO 1996b; WHO 2004). As worldwide life expectancy increases, chronic neurological diseases such as Parkinsonian disorders associated with Mn exposure are likely to increase, especially in developing countries (Dorsey et al. 2007; Ferri et al. 2005; He et al. 2005). Thus high intake of Mn by Bangladeshis may increase Parkinsonian disorders associated with Mn exposure.

    3. Uranium. U concentrations ranged from <0.2 µg/L to 10 µg/L, with 48% of tubewells above the 2 µg/L WHO health-based drinking water guideline (Table 1). This WHO guideline was calculated using the Lowest Observed Adverse Effects Level (LOAEL) for kidney lesions in male laboratory rats (WHO 1998a; WHO 1998b). The carcinogenic effect of U in drinking water at natural isotopic abundance (238U at 99.2830%, 235U at 0.7110%, and 234U at 0.0054%) has not been adequately studied in humans and experimental animals (CRC Press 1983; WHO 1998a; WHO 1998b).

      The first study on humans of the effects of chronic U ingestion from drinking water showed adverse kidney function with the proximal tubule as the site of toxicity (Zamora et al. 1998). Later, a much larger study on exposure of humans to U in drinking water revealed nephrotoxic effects even at low concentrations without a clear threshold (Kurittio et al. 2002). In another study, the same authors found that people who drank water with elevated concentrations of U had indications that, in addition to kidneys, bone may be another target of toxicity (Kurittio et al. 2005).

    4. Lead. Pb concentrations ranged from <0.2 µg/L to 17 µg/L, with 1% of tubewells above the 10 µg/L WHO health-based drinking water guideline (Table 1; WHO 2004; WHO 2006). The WHO drinking water guideline for Pb was calculated using the lowest measurable retention of Pb in the blood and tissues of human infants (WHO 1996a; WHO 1996b). Lead is a "possible human carcinogen" due to inconclusive evidence of human and sufficient evidence of animal carcinogenicity. Oral exposure to Pb has been found to increase the incidence of renal tumors in laboratory rats, mice, and hamsters (WHO 1996a; WHO 1996b; WHO 2004; WHO 2006). In addition, Pb also causes many non-carcinogenic disorders in humans including, but not limited to, "neurotoxicity, developmental delays, hypertension, impaired hearing acuity, impaired hemoglobin synthesis, and male reproductive impairment" (U.S. EPA 2008). The effects of Pb on the central nervous system of fetuses, infants, children up to 6 years of age, and pregnant women can be especially serious (WHO 1996a; WHO 1996b).

    5. Nickel. Ni concentrations ranged from 0.5 µg/L to 570 µg/L, with 1% of tubewells above the 70 µg/L WHO health-based drinking water guideline (Table 1). This WHO guideline was calculated using the LOAEL in a study of oral exposure to fasting patients (WHO 2006). Nickel compounds are "carcinogenic to humans" by inhalation exposure. In contrast, the carcinogenic effects of Ni in drinking water for humans have not been adequately studied. Nickel in drinking water did not increase the incidence of tumors in laboratory rats (WHO 1998a; WHO 1998b; WHO 2006).

    6. Chromium. Total Cr concentrations ranged from <0.5 µg/L to 100 µg/L, with 1% of tubewells above the 50 µg/L WHO drinking water guideline (Table 1; WHO 2004; WHO 2006). The International Agency for Research on Cancer categorizes Cr(VI) as "carcinogenic to humans" and Cr(III) as "not classifiable" (IARC 1987); however, the United States Environmental Protection Agency (U.S. EPA) lists total Cr in drinking water as having "inadequate or no human and animal evidence of carcinogenicity" (U.S. EPA 1996). The WHO states that the 50 µg/L drinking water guideline for total Cr is unlikely to cause significant health risks (WHO 1996a; WHO 1996b).

    7. Boron. B concentrations ranged from <50 µg/L to 440 µg/L, with no tubewells greater than the 500 µg/L WHO health-based drinking water guideline (Table 1; WHO 2004; WHO 2006). However, 5.3% of Bangladesh’s tubewells exceeded this WHO guideline in a national-scale survey (BGS/DPHE 2001).

    8. Barium. Ba concentrations ranged from 28 µg/L to 690 µg/L, with no tubewells greater than the 700 µg/L WHO health-based drinking water guideline (Table 1; WHO 2004; WHO 2006). However, 0.3% of Bangladesh’s tubewells exceeded this WHO guideline in a national-scale survey (BGS/DPHE 2001).

    9. Iron. Fe concentrations ranged from <40 µg/L to 66,000 µg/L (Table 1). The WHO has not established a health-based drinking water guideline for Fe (WHO 2004; WHO 2006). However, high body Fe stores and high dietary intakes of Fe are associated with hepatocellular carcinoma in humans (Marrogi et al. 2001) and mammary carcinogenesis in female Sprague-Dawley rats (Diwan et al. 1997). Bangladeshis ingest approximately 12%, 62%, and 26% of their dietary Fe from drinking water, eating rice, and ingesting soil, respectively; in Bangladesh Fe is ingested at almost 2 times its Recommended Dietary Allowance (RDA; Ortega et al. 2003).

    10. Molybdenum. Mo concentrations ranged from 0.5 µg/L to 7.8 µg/L, with no tubewells greater than the 70 µg/L WHO health-based drinking water guideline (Table 1; WHO 2004; WHO 2006). In contrast, an unspecified percent of Bangladesh’s tubewells exceeded this WHO guideline in a national-scale survey (BGS/DPHE 2001).

    11. Antimony. Sb concentrations ranged from <0.5 µg/L to 6.2 µg/L, with no tubewells greater than the 20 µg/L WHO health-based drinking water guideline (Table 1; WHO 2004; WHO 2006). However, 81% of the samples with detectable concentrations of As had detectable concentrations of Sb (Table 2). Antimony in drinking water has been reported to modulate the toxicity of As (Gebel 1999). Therefore, it is possible that otherwise safe levels of Sb may cause a magnification of As toxicity.

      Antimony trioxide (Sb2O3) is "possibly carcinogenic to humans" by inhalation exposure. In contrast, the effect of Sb in drinking water on cancer in humans has not been adequately studied. Antimony in drinking water did not increase the incidence of tumors in laboratory mice and rats (WHO 1996a; WHO 1996b; WHO 2004; WHO 2006). The WHO guideline for Sb in drinking water was calculated using the NOAEL for decreased water intake, food intake, and body weight in laboratory rats (WHO 2004; WHO 2006).

    12. Selenium. Se concentrations ranged from <1 µg/L to 1 µg/L, with no tubewells greater than the 10 µg/L WHO guideline (Table 1; WHO 2004; WHO 2006). Selenium is needed for human nutrition. Selenium does not appear to cause cancer, with the exception of selenium sulfide, which is not found in drinking water (WHO 1996a; WHO 1996b). The NOAEL for Se in humans is 4 µg/kg of body weight per day. In this light, the WHO set the health-based guideline for Se in drinking water at 10 µg/L (WHO 2004; WHO 2006).

      Selenium prevents the cytotoxic effects of As (Biswas et al. 1999). Unfortunately, the food crops in Bangladesh are sometimes deficient in Se (Ortega et al. 2003), and the drinking water in Bangladesh is often deficient in Se (Frisbie et al. 2002). Therefore, it is possible that this lack of Se in food and drinking water might cause a magnification of As toxicity.

    13. Zinc. Zn concentrations ranged from 2.6 µg/L to 88 µg/L (Table 1). Zinc is needed by all living organisms. The Provisional Maximum Tolerable Daily Intake (PMTDI) for Zn in humans is 1,000 µg/kg of body weight. In this light, the WHO concluded that a health-based guideline for Zn in drinking water "is not required" (WHO 2004; WHO 2006).

      In Bangladesh, the severity of chronic As poisoning may be magnified by a lack of dietary Zn (Frisbie et al. 2002; Ortega et al. 2003). Zinc promotes the repair of tissues damaged by As (Engel et al. 1994). Food, not drinking water, is the major source of dietary Zn (WHO 1996a), but the agricultural soils, food crops, and diet in Bangladesh are often deficient of Zn (Brammer 1996; Ortega et al. 2003). Therefore, it is possible that this lack of Zn in soils, food, and drinking water may cause a magnification of As toxicity.

  2. Ramifications for the Monitoring, Treatment, and Distribution of Drinking Water. The average concentrations of toxic elements from all 67 tubewells in this study are listed in Table 1. Thirty-three percent (22 out of 67) of these tubewells exceed the 10 µg/L WHO health-based drinking water guideline for As (Table 1).

    1. Analysis of Tubewells with Unsafe Concentrations of Arsenic. The average concentrations of toxic elements from the 22 tubewells with unsafe concentrations of As are listed in Table 3. That is, 100%, 59%, 14%, 5%, 5%, and 5% of these 22 tubewells had unsafe concentrations of As, Mn, U, Pb, Ni, and Cr, respectively (Table 3). This suggests that drinking water wells with unsafe concentrations of As may also have unsafe concentrations of Mn, U, Pb, Ni, Cr, or possibly other elements.

      Table 3. The average concentrations of toxic elements in Bualda, Fulbaria, Jamjami, and Komlapur’s groundwater from all tubewells that exceed the WHO health-based drinking water guideline for As. (Reproduced from Frisbie SH, Mitchell EJ, Mastera LJ, Maynard DM, Yusuf AZ, Siddiq MY, Ortega R, Dunn RK, Westerman DS, Bacquart T, Sarkar B. Public health strategies for western Bangladesh that address the arsenic, manganese, uranium and other toxic elements in their drinking water. Environmental Health Perspectives doi: 10.1289/ehp.11886 (available at http://dx.doi.org/) Online 7 October 2008.)

      Element Average Concentration
      (µg/L)
      WHO Health-Based
      Guideline (µg/L)
      % of Unsafe
      Tubewells a
      As
      B
      Ba
      Cr
      Fe
      Mn
      Mo
      Ni
      Pb
      Sb
      Se c
      U
      Zn c
      84
      <50
      220
      9.5
      7,300
      870
      2.0
      31
      1.2
      2.3
      <1
      0.9
      21
      10
      500
      700
      50
      NA b
      400
      70
      70
      10
      20
      10
      2
      NA
      100
      0
      0
      5
      NA
      59
      0
      5
      5
      0
      0
      14
      NA

      a By definition, 100% (22 out of 22) of these tubewells are unsafe. All of these tubewells exceed the 10 µg/L WHO health-based drinking water guideline for As.
      b The WHO has not established a health-based drinking water guideline for Fe or Zn (WHO 1996a; WHO 1998a).
      c The severity of chronic As poisoning in Bangladesh might be magnified by a lack of Se or Zn or both (Frisbie et al. 2002; Ortega et al. 2003).

      In this neighborhood-scale study and in 2 national-scale studies of Bangladesh, As, Mn, U, Pb, Ni, Cr, B, Ba, and Mo were found above WHO health-based drinking water guidelines (Table 1; BGS/DPHE 2001; Frisbie et al. 2002). In Bualda as the concentration of As increases there are statistically significant increases in the concentrations of Mn, Pb, Ni, Cr, and B (Table 4). In Jamjami as the concentration of As increases there are statistically significant increases in the concentrations of Pb, Ni, and Ba (Table 4). In Komlapur as the concentration of As increases there are statistically significant increases in the concentrations of Cr, and Ba (Table 4). Finally, in the entire region as the concentration of As increases there are statistically significant increases in the concentrations of Mn, Pb, Cr, B, Ba, and Mo (Table 2).

      Table 4. Correlation coefficients (r) for the concentration of As versus the concentrations of toxic elements in tubewell water from each of the 4 neighborhoods in this study, the pH of this water, the depth of these tubewells, the age of these tubewells, and the number of users per tubewell. Significant linear relationships at the 99% confidence level are shown with a superscript "a". Significant linear relationships at the 95% confidence level are shown with a superscript "b". No significant linear relationships at either confidence level do not have a superscript. (Reproduced from Frisbie SH, Mitchell EJ, Mastera LJ, Maynard DM, Yusuf AZ, Siddiq MY, Ortega R, Dunn RK, Westerman DS, Bacquart T, Sarkar B. Public health strategies for western Bangladesh that address the arsenic, manganese, uranium and other toxic elements in their drinking water. Environmental Health Perspectives doi: 10.1289/ehp.11886 (available at http://dx.doi.org/) Online 7 October 2008.)

      Element As
      Bualda Fulbaria Jamjami Komlapur
      As 1.00a 1.00a 1.00a 1.00a
      B 0.91a 0.18 -0.03 -0.19
      Ba 0.16 0.14 0.69a 0.74a
      Cr 0.91a 0.23 0.45 0.60b
      Fe 0.91a 0.21 0.61a 0.66a
      Mn 0.49b 0.33 -0.04 -0.39
      Mo 0.21 0.09 -0.24 0.27
      Ni 0.91a 0.25 0.49b 0.30
      Pb 0.91a 0.20 0.52b 0.24
      Sb 0.37 -0.18 0.39 0.26
      Se 0.40 0.14 0.47 0.53b
      U 0.03 -0.16 -0.55b -0.30
      Zn 0.96a -0.14 0.34 0.06
      pH 0.27 -0.32 0.09 0.08
      Depth 0.07 -0.09 -0.69a -0.03
      Age -0.19 0.03 -0.34 0.01
      Users -0.23 -0.17 -0.33 -0.26

      Almost all of the home-scale drinking water treatment systems currently being used in Bangladesh have been designed to remove As, but not these other toxic elements. The statistically significant increases in toxic elements with As suggest that these treatment systems should be further evaluated for the removal of Mn, Pb, Ni, Cr, B, Ba, Mo, and possibly other elements.

    2. Analysis of Tubewells with Safe Concentrations of Arsenic. The average concentrations of toxic elements from the 45 tubewells with safe concentrations of As are listed in Table 5. That is, 87%, and 64% of these 45 tubewells had unsafe concentrations of Mn, and U, respectively (Table 5). In fact, 93% (42 out of 45) of these tubewells had unsafe concentrations of Mn, U, or both Mn and U (Table 5). This suggests that drinking water wells with safe concentrations of As may have unsafe concentrations of Mn, U, or possibly other elements. Thus, the current practice of testing every tubewell for just As will not identify drinking water with safe concentrations of other toxic elements.

      Table 5. The average concentrations of toxic elements in Bualda, Fulbaria, Jamjami, and Komlapur’s groundwater from all tubewells that did not exceed the WHO health-based drinking water guideline for As. (Reproduced from Frisbie SH, Mitchell EJ, Mastera LJ, Maynard DM, Yusuf AZ, Siddiq MY, Ortega R, Dunn RK, Westerman DS, Bacquart T, Sarkar B. Public health strategies for western Bangladesh that address the arsenic, manganese, uranium and other toxic elements in their drinking water. Environmental Health Perspectives doi: 10.1289/ehp.11886 (available at http://dx.doi.org/) Online 7 October 2008.)

      Element Average Concentration
      (µg/L)
      WHO Health-Based
      Guideline (µg/L)
      % of Unsafe
      Tubewells a
      As
      B
      Ba
      Cr
      Fe
      Mn
      Mo
      Ni
      Pb
      Sb
      Se c
      U
      Zn c
      <7
      <50
      110
      2.4
      400
      770
      1.2
      1.0
      <0.2
      1.2
      <1
      3.2
      12
      10
      500
      700
      50
      NA b
      400
      70
      70
      10
      20
      10
      2
      NA
      0
      0
      0
      0
      NA
      87
      0
      0
      0
      0
      0
      64
      NA

      a Ninety-three percent (42 out of 45) of these tubewells are unsafe. That is, only 7% (3 out of 45) of these tubewells do not exceed any of these WHO health-based drinking water guidelines.
      b The WHO has not established a health-based drinking water guideline for Fe or Zn (WHO 1996a; WHO 1998a).
      c The severity of chronic As poisoning in Bangladesh might be magnified by a lack of Se or Zn or both (Frisbie et al. 2002; Ortega et al. 2003).

      In response to this finding that Mn, U, and possibly other toxic elements commonly occur at unsafe concentrations even when As is at safe concentrations, the following 3-step testing program is proposed to provide safe drinking water in western Bangladesh, and possibly the entire country. This testing program is economical because it prioritizes the analysis of toxic elements, and stops these analyses as soon as a sample is found to be unsafe for use as drinking water.

      First, the toxicity and distribution of As relative to Mn, U, Pb, Ni, Cr, B, Ba, and Mo suggest that the current practice of sampling and testing every tubewell in Bangladesh for As to find the safest sources of drinking water stay as the highest public health priority. Arsenic is expected to cause at least 150,000 extra cancer deaths during the life spans of the current population of Bangladesh (Frisbie et al. 2005). In contrast, the risk to public health in Bangladesh is smaller for Mn, U, Pb, Ni, Cr, B, Ba, and Mo than for As (Frisbie et al. 2002; WHO 1996b; WHO 1998b). Under conditions of limited resources, testing of these toxic elements must be prioritized.

      Second, the high concentrations of As, Mn, and U relative to Pb, Ni, Cr, B, Ba, and Mo suggest that if a sample meets the WHO guideline for As, it should be retested for Mn and U. This will identify tubewells with safe concentrations of As, Mn, and U for additional evaluation as a potential drinking water supply in these neighborhoods without the cost or delay of testing for all 9 elements. For example, 1 tubewell in Fulbaria, 1 tubewell in Jamjami, and 1 tubewell in Komlapur did not exceed WHO health-based drinking water guidelines for As, Mn, and U.

      Third, if a sample meets the WHO guidelines for As, Mn and U, then it should be retested for Pb, Ni, Cr, B, Ba, and Mo. All tubewells that do not exceed WHO guidelines for these 9 elements could be used as public drinking water supplies. For example, the same 1 tubewell in Fulbaria, 1 tubewell in Jamjami, and 1 tubewell in Komlapur did not exceed any WHO health-based drinking water guidelines and could supply safe drinking water to the residents of each neighborhood.

      Testing for just As and then asking the owners of safe tubewells to share drinking water with their less fortunate neighbors has been a highly successful public health strategy in Bangladesh. Over 90% of western Bangladeshis share drinking water (Frisbie et al. 2005). The 3-step testing program builds on this success by testing for all known toxic elements in Bangladesh’s drinking water, not just As.

      Unfortunately, no tubewells in Bualda met WHO guidelines for all elements; therefore, drinking water treatment will likely be required in this neighborhood. However, this testing strategy will help the residents of places like Bualda choose the safest tubewells for interim use until a treatment plant can be built.

      All tubewells identified as safe by this 3-step process should be used as public drinking water supplies. These safe tubewells must be periodically monitored for As, Mn, U, Pb, Ni, Cr, B, Ba, and Mo. If a tubewell becomes unsafe, then an alternative drinking water supply must be identified, or the unsafe water must be treated.

      Our earlier national-scale survey suggested that groundwater with unsafe levels of As, Mn, U, Pb, Ni, Cr, B, Ba, and Mo extend beyond Bangladesh’s borders into the 4 adjacent and densely populated Indian states of West Bengal, Assam, Meghalaya, and Tripura (Frisbie et al. 2002). The present neighborhood-scale survey in western Bangladesh borders the West Bengal districts of Nadia and 24-Parganas, where aquifers with similar characteristics occur (Bhattacharya et al. 2002). Thus, we urge that a similar survey be done in West Bengal to investigate possible exposure to unsafe levels of Mn, U, Pb, Ni, Cr, B, Ba and Mo in addition to As in drinking water.

    3. The Relationship between Arsenic, Manganese, and Uranium. The results from Tables 3 and 5 suggest that Mn is often at unsafe concentrations in Bangladesh’s tubewell water. Over 50% of Bangladesh’s area has groundwater with Mn concentrations greater than the WHO health-based drinking water guideline (Frisbie et al. 2002). In addition, the contrast between 14% of tubewells with unsafe concentrations of U in the tubewells with unsafe concentrations of As (Table 3) and 64% of tubewells with unsafe concentrations of U in the tubewells with safe concentrations of As (Table 5) suggests that drinking water from western Bangladesh with safe concentrations of U may have unsafe concentrations of As, while drinking water from western Bangladesh with safe concentrations of As may have unsafe concentrations of U. In summary, the drinking water in these neighborhoods generally has unsafe levels of As and Mn, or U and Mn; however, it seldom (4%, 3 out of 67 tubewells) has unsafe concentrations of both As and U together. Figures 2, 3, and 4 illustrate the relationship between As and Mn, U and Mn, and As and U.

      Contour map of As concentration (µg/L) in tubewell water from Jamjami.
      Figure 2. Contour map of As concentration (µg/L) in tubewell water from Jamjami. White circles are shallow tubewells (18 to 27 m below ground surface, bgs), gray circles are intermediate tubewells (28 to 37 m bgs), and black circles are deep tubewells (38 to 55 m bgs). The red contour line represents the 10 µg/L WHO health-based drinking water guideline. (Reproduced from Frisbie SH, Mitchell EJ, Mastera LJ, Maynard DM, Yusuf AZ, Siddiq MY, Ortega R, Dunn RK, Westerman DS, Bacquart T, Sarkar B. Public health strategies for western Bangladesh that address the arsenic, manganese, uranium and other toxic elements in their drinking water. Environmental Health Perspectives doi: 10.1289/ehp.11886 (available at http://dx.doi.org/) Online 7 October 2008.)

      Contour map of Mn concentration (µg/L) in tubewell water from Jamjami.
      Figure 3. Contour map of Mn concentration (µg/L) in tubewell water from Jamjami. White circles are shallow tubewells (18 to 27 m below ground surface, bgs), gray circles are intermediate tubewells (28 to 37 m bgs), and black circles are deep tubewells (38 to 55 m bgs). The red contour line represents the 400 µg/L WHO health-based drinking water guideline. (Reproduced from Frisbie SH, Mitchell EJ, Mastera LJ, Maynard DM, Yusuf AZ, Siddiq MY, Ortega R, Dunn RK, Westerman DS, Bacquart T, Sarkar B. Public health strategies for western Bangladesh that address the arsenic, manganese, uranium and other toxic elements in their drinking water. Environmental Health Perspectives doi: 10.1289/ehp.11886 (available at http://dx.doi.org/) Online 7 October 2008.)

      Contour map of U concentration (µg/L) in tubewell water from Jamjami.
      Figure 4. Contour map of U concentration (µg/L) in tubewell water from Jamjami. White circles are shallow tubewells (18 to 27 m below ground surface, bgs), gray circles are intermediate tubewells (28 to 37 m bgs), and black circles are deep tubewells (38 to 55 m bgs). The red contour line represents the 2 µg/L WHO health-based drinking water guideline. (Reproduced from Frisbie SH, Mitchell EJ, Mastera LJ, Maynard DM, Yusuf AZ, Siddiq MY, Ortega R, Dunn RK, Westerman DS, Bacquart T, Sarkar B. Public health strategies for western Bangladesh that address the arsenic, manganese, uranium and other toxic elements in their drinking water. Environmental Health Perspectives doi: 10.1289/ehp.11886 (available at http://dx.doi.org/) Online 7 October 2008.)

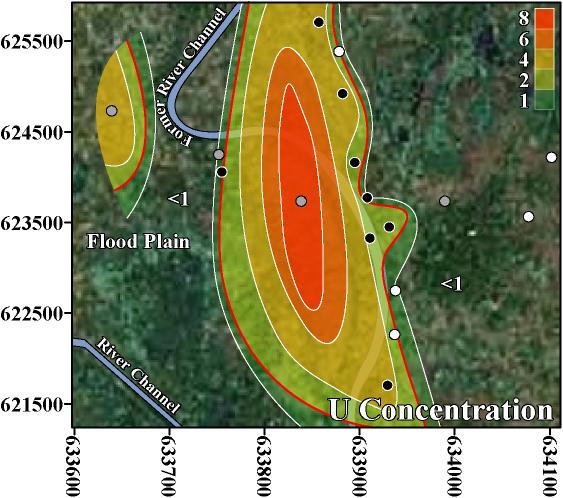
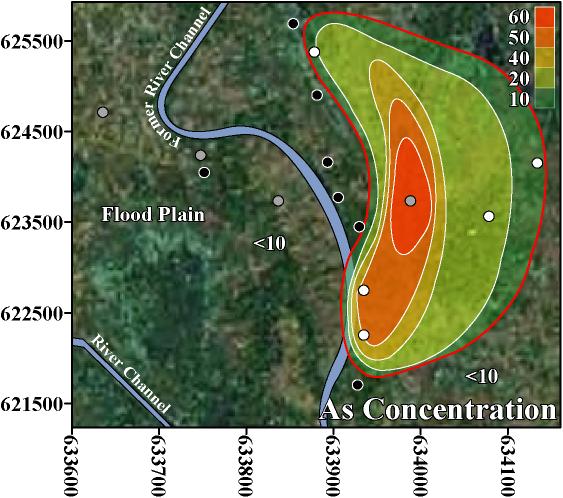
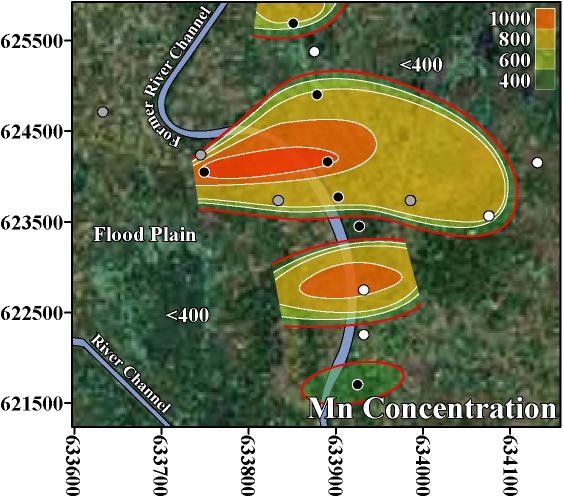
      The inverse trend between As and U may be caused by the variability that is characteristic of delta-alluvial plain deposits from the Bengal Delta Plain in Bangladesh and West Bengal, India. For example, in Jamjami the concentration of As decreases with depth (p-value = 0.002, Figure 2), and the concentration of U increases with depth (p-value = 0.04, Figure 4). Komlapur, to some extent, also shows these trends. In contrast, Bualda and Fulbaria do not show any trends between As and depth, and U and depth. The aquifers in Jamjami and possibly Komlapur have medium-coarse grained sand at depth that was deposited in former river channels (Alam et al. 1990). The groundwater drawn into tubewells that are screened in these deposits may be under oxidizing conditions that remove As from groundwater and release U into groundwater. In contrast, the aquifers in all 4 neighborhoods have organic-rich mud at all depths that was deposited in flood plains (Alam et al. 1990). The groundwater drawn into tubewells that are screened in these deposits may be under reducing conditions that release As into groundwater and remove U from groundwater. Therefore, alluvial sediments of the Bengal Delta Plain make a complex 3-dimensional stratigraphy of medium-coarse grained sand and organic-rich mud deposits that may be responsible for the inverse trend between As and U. Other factors may also be controlling release of As and U. It is important to note that in areas where drilling deeper tubewells may access water with lower levels of As, the water from these deeper tubewells may contain increased levels of U, as was found in Jamjami and Komlapur.

      Despite this inverse trend, 4% (3 out of 67) of the tubewells in this study had unsafe concentrations of both As and U. This is important because the home-scale drinking water filters that are being used in Bangladesh may not remove U. Also, up to 50% of Bangladesh’s tubewells exceed the WHO health-based drinking water guideline for U (BGS/DPHE 2001). The water treatment filters used in Bangladesh typically oxidize soluble As(III) to insoluble As(V) to remove As by absorption or precipitation. However, this oxidation may convert insoluble U(IV) to soluble U(VI) and potentially increase the U concentration of the water after treatment. Alternatively, this oxidation may keep dissolved U in the VI oxidation state and potentially cause no change in the U concentration of the water after treatment (Fairbridge 1972). Thus, these filters should be further evaluated for the removal of U.

Go To Next Page Go To Previous Page Return To Homepage Learn About Better Life Laboratories How to Make a Tax Deductible Contribution of Money or Equipment to Better Life Laboratories


Last updated November 26, 2008
Copyright © 2008 Better Life Laboratories, Inc. All rights reserved.